Analysis allows user to create scenarios or treatment strategies to assess long term condition for a given Model and Data set.

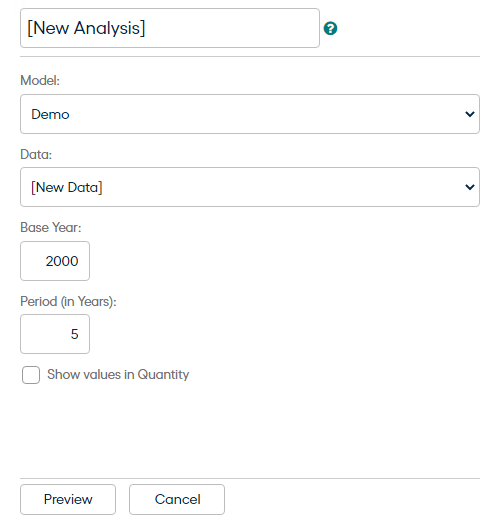
New Analysis: Placeholder to define Analysis Name.
Model: Allows to select a Model, based on which Data will be populated, for which Analysis is to be created.
Data: Allows to Select a Data for the Model selected, for which Analysis is to be created.
Base Year: Start year of the Analysis.
Period: No. of years for which analysis output is to be generated.
Show values in Quantity: If checked, the analysis graphs will show value in quantity, else percentage.
Preview will create a blank analysis and allow user to define a Treatment Strategy.
Treatment Strategy
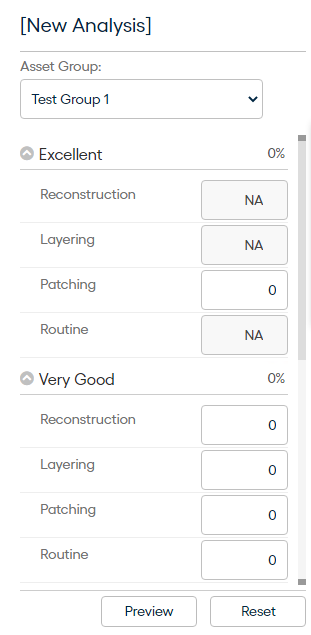
Treatment Strategy allows user to create scenario(s) wherein user decides the treatment types that are to be done on an Asset Group, in a given condition. It also allows users to specify the percentage of total quantity of Asset Group that should be covered with a treatment type, in a given condition. Treatment Strategy is formulated per Asset Group.

Asset Group: Allows to select the Asset Group within the Model/Data of the Analysis to create a treatment Strategy.
All the conditions for each Asset Group are available to define a treatment strategy.
Preview: Generates following output graphs, for each Asset Group, based on treatment strategy created for each Asset Group.
Individual Distribution
Condition - Do Nothing: It displays the long term condition profile of an Asset Group in case of no treatment strategy in place.
Condition - Treatment Strategy Applied : It displays the long term condition profile of an Asset Group with treatment strategy applied.
Work Quantity Graph: It displays the work done per Asset Group per Treatment Type for the strategy formulated. In case of no strategy, the graph displays no data
Expenditure by Treatment Graph: Expenditure by Treatment graph displays the expenditure per Asset Group per Treatment Type for the strategy formulated. In case of no strategy, the graph displays no data.
Expenditure by Condition Graph: It displays the expenditure per Asset Group per Condition for the strategy formulated. In case of no strategy, the graph displays no data.
Overall values
Set of graphs for each Asset Group with Average Remaining Useful Life of the asset group and corresponding expenditure based on Treatment Strategy.
Average Remaining Useful Life: Takes the average of individual condition distribution and generates an overall condition of the Asset Group for each year based on the remaining useful life defined for each condition.
Average Condition Score: Takes the average of individual condition distribution and generates an overall condition of the Asset Group for each year based on the condition score defined for each condition.
Total Expenditure: Aggregates the expenditure for each year for the Asset Group.
Aggregate: Switching Aggregate ON will generate the aggregated view of all the Asset Groups within the Analysis. All the individual graphs and the overall value graphs are aggregated. For independent Model if Asset Groups are measured in different units then only Expenditure Graph is aggregated.
Compare: Allows two or more analysis sharing the same Model, Data and Base Year to be compared with each other for overall values.